Welcome to the future of Docket Navigator Analytics!
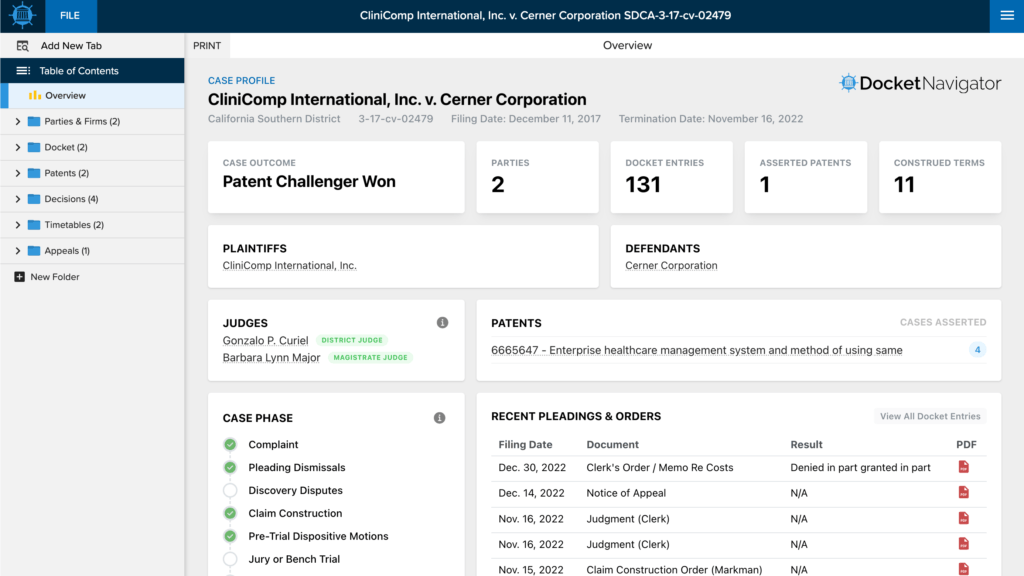
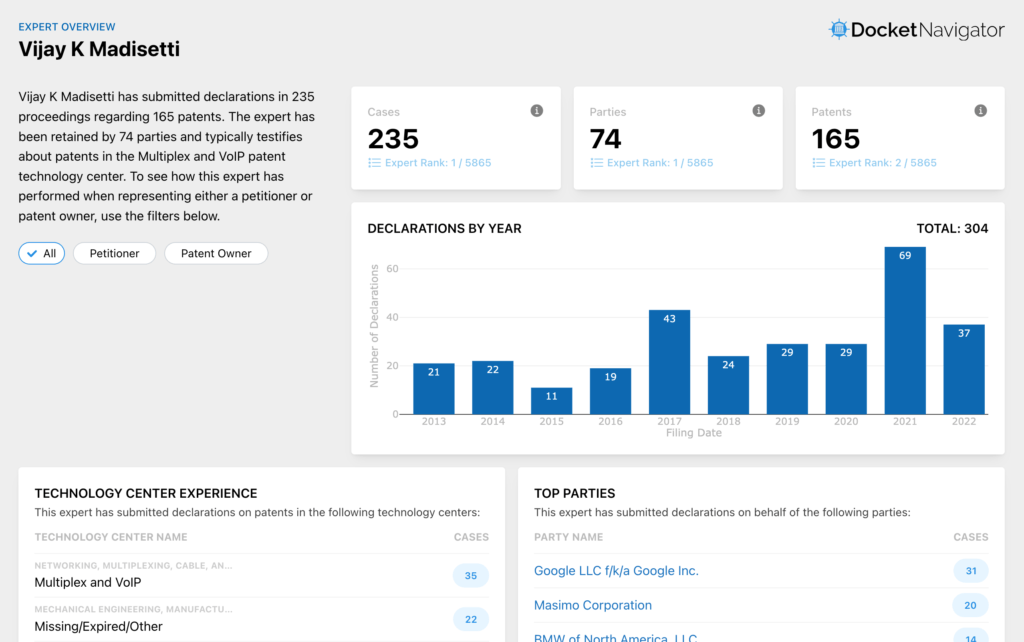
This year we’ve been hard at work on a full spectrum rebuild of our analytics toolkit to give our users faster, more focused data visualizations and easy access to the data behind the charts. Here are a few of the features that come with the upgraded analytics toolkit.
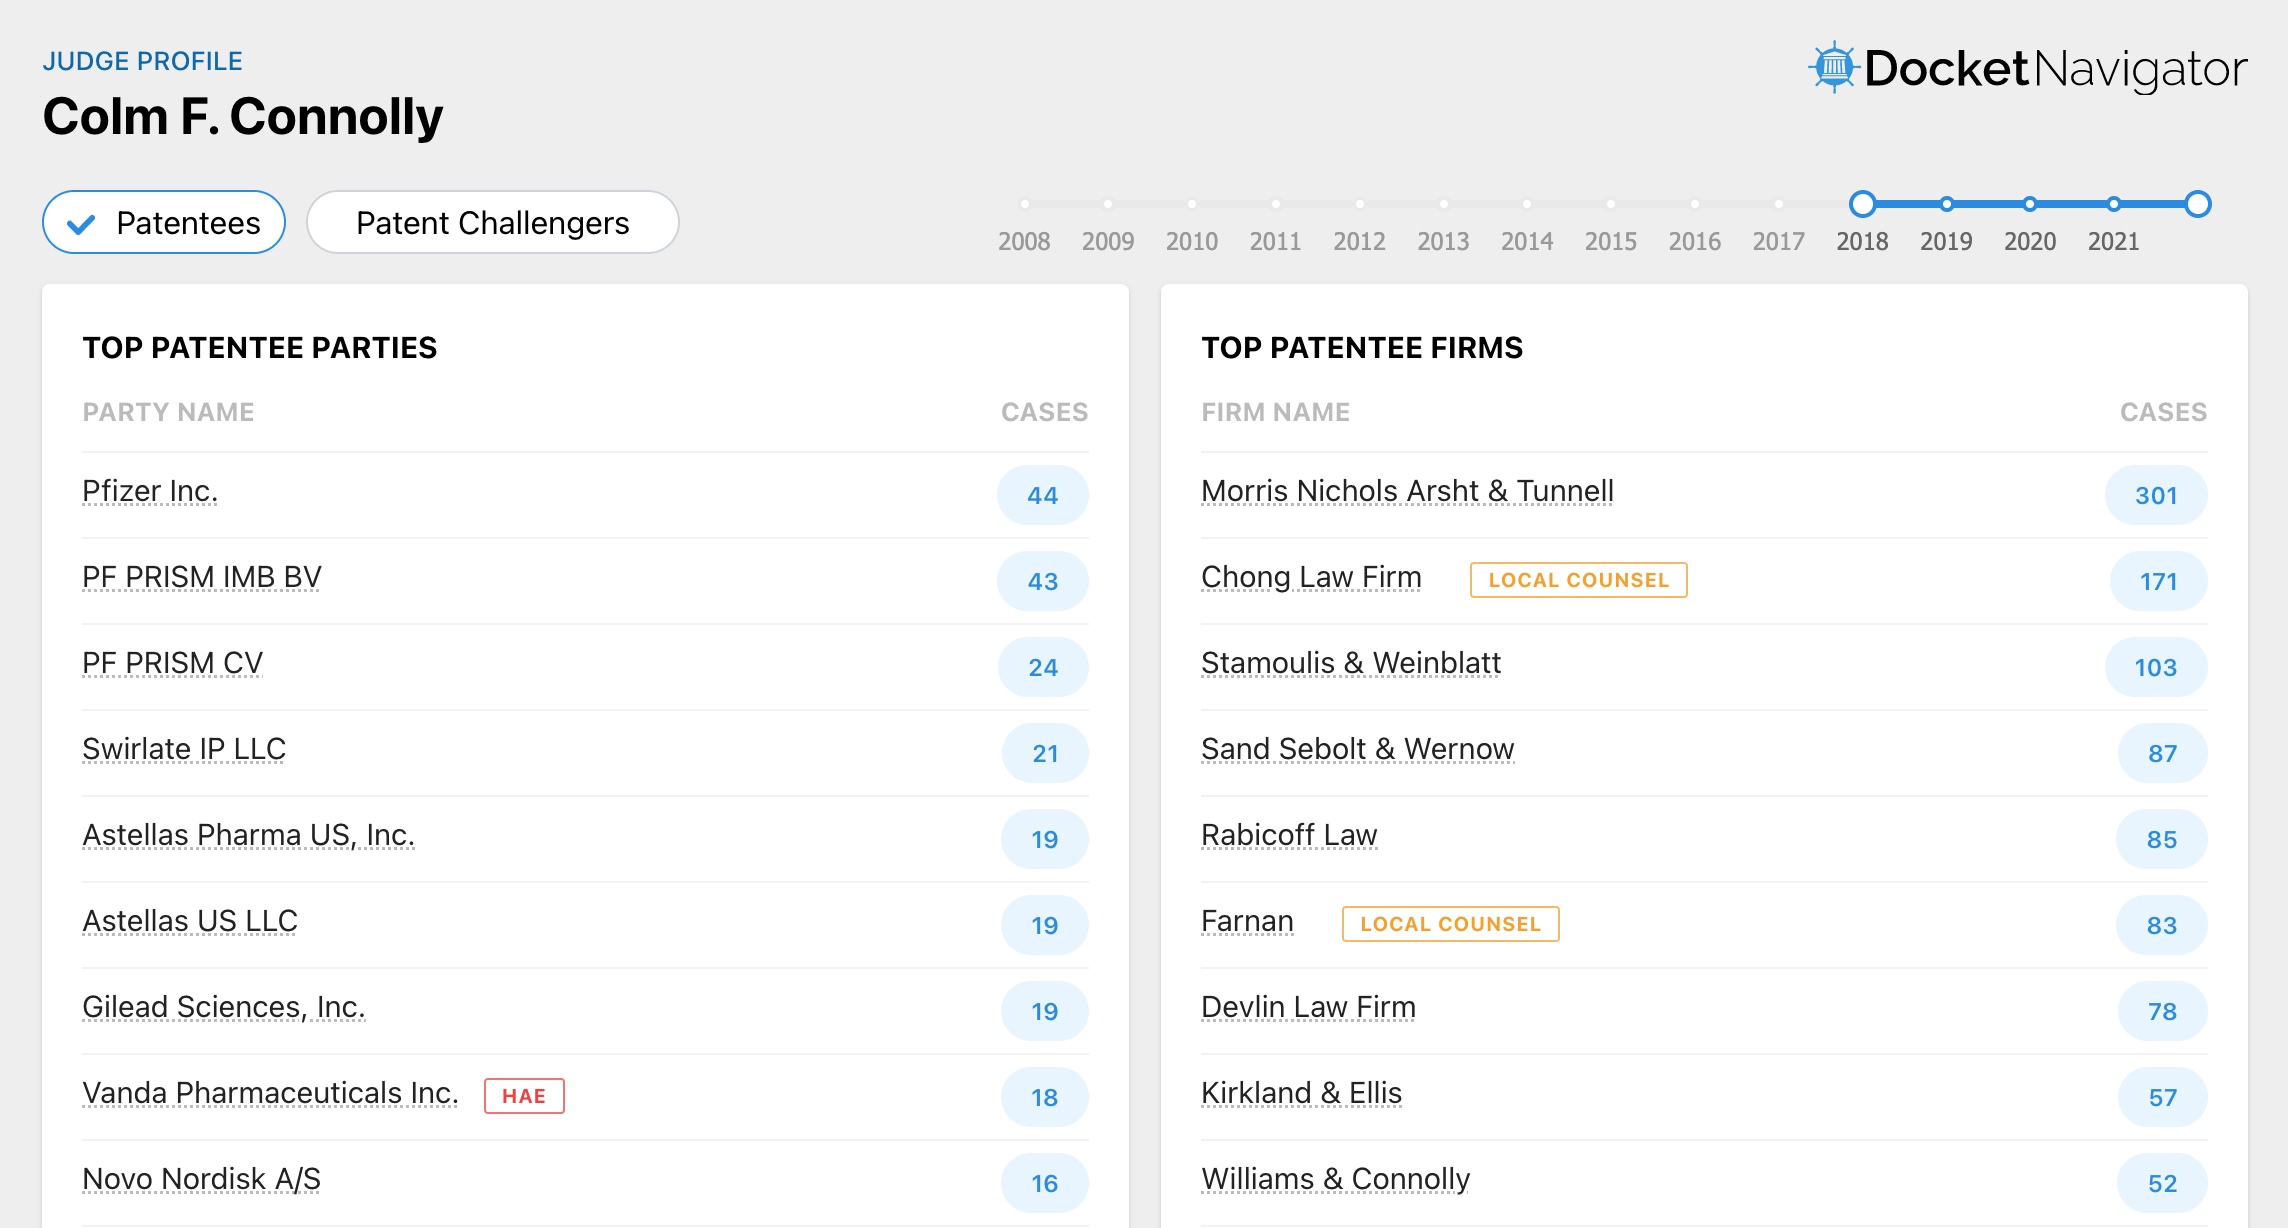
New Judge Profile Tabs
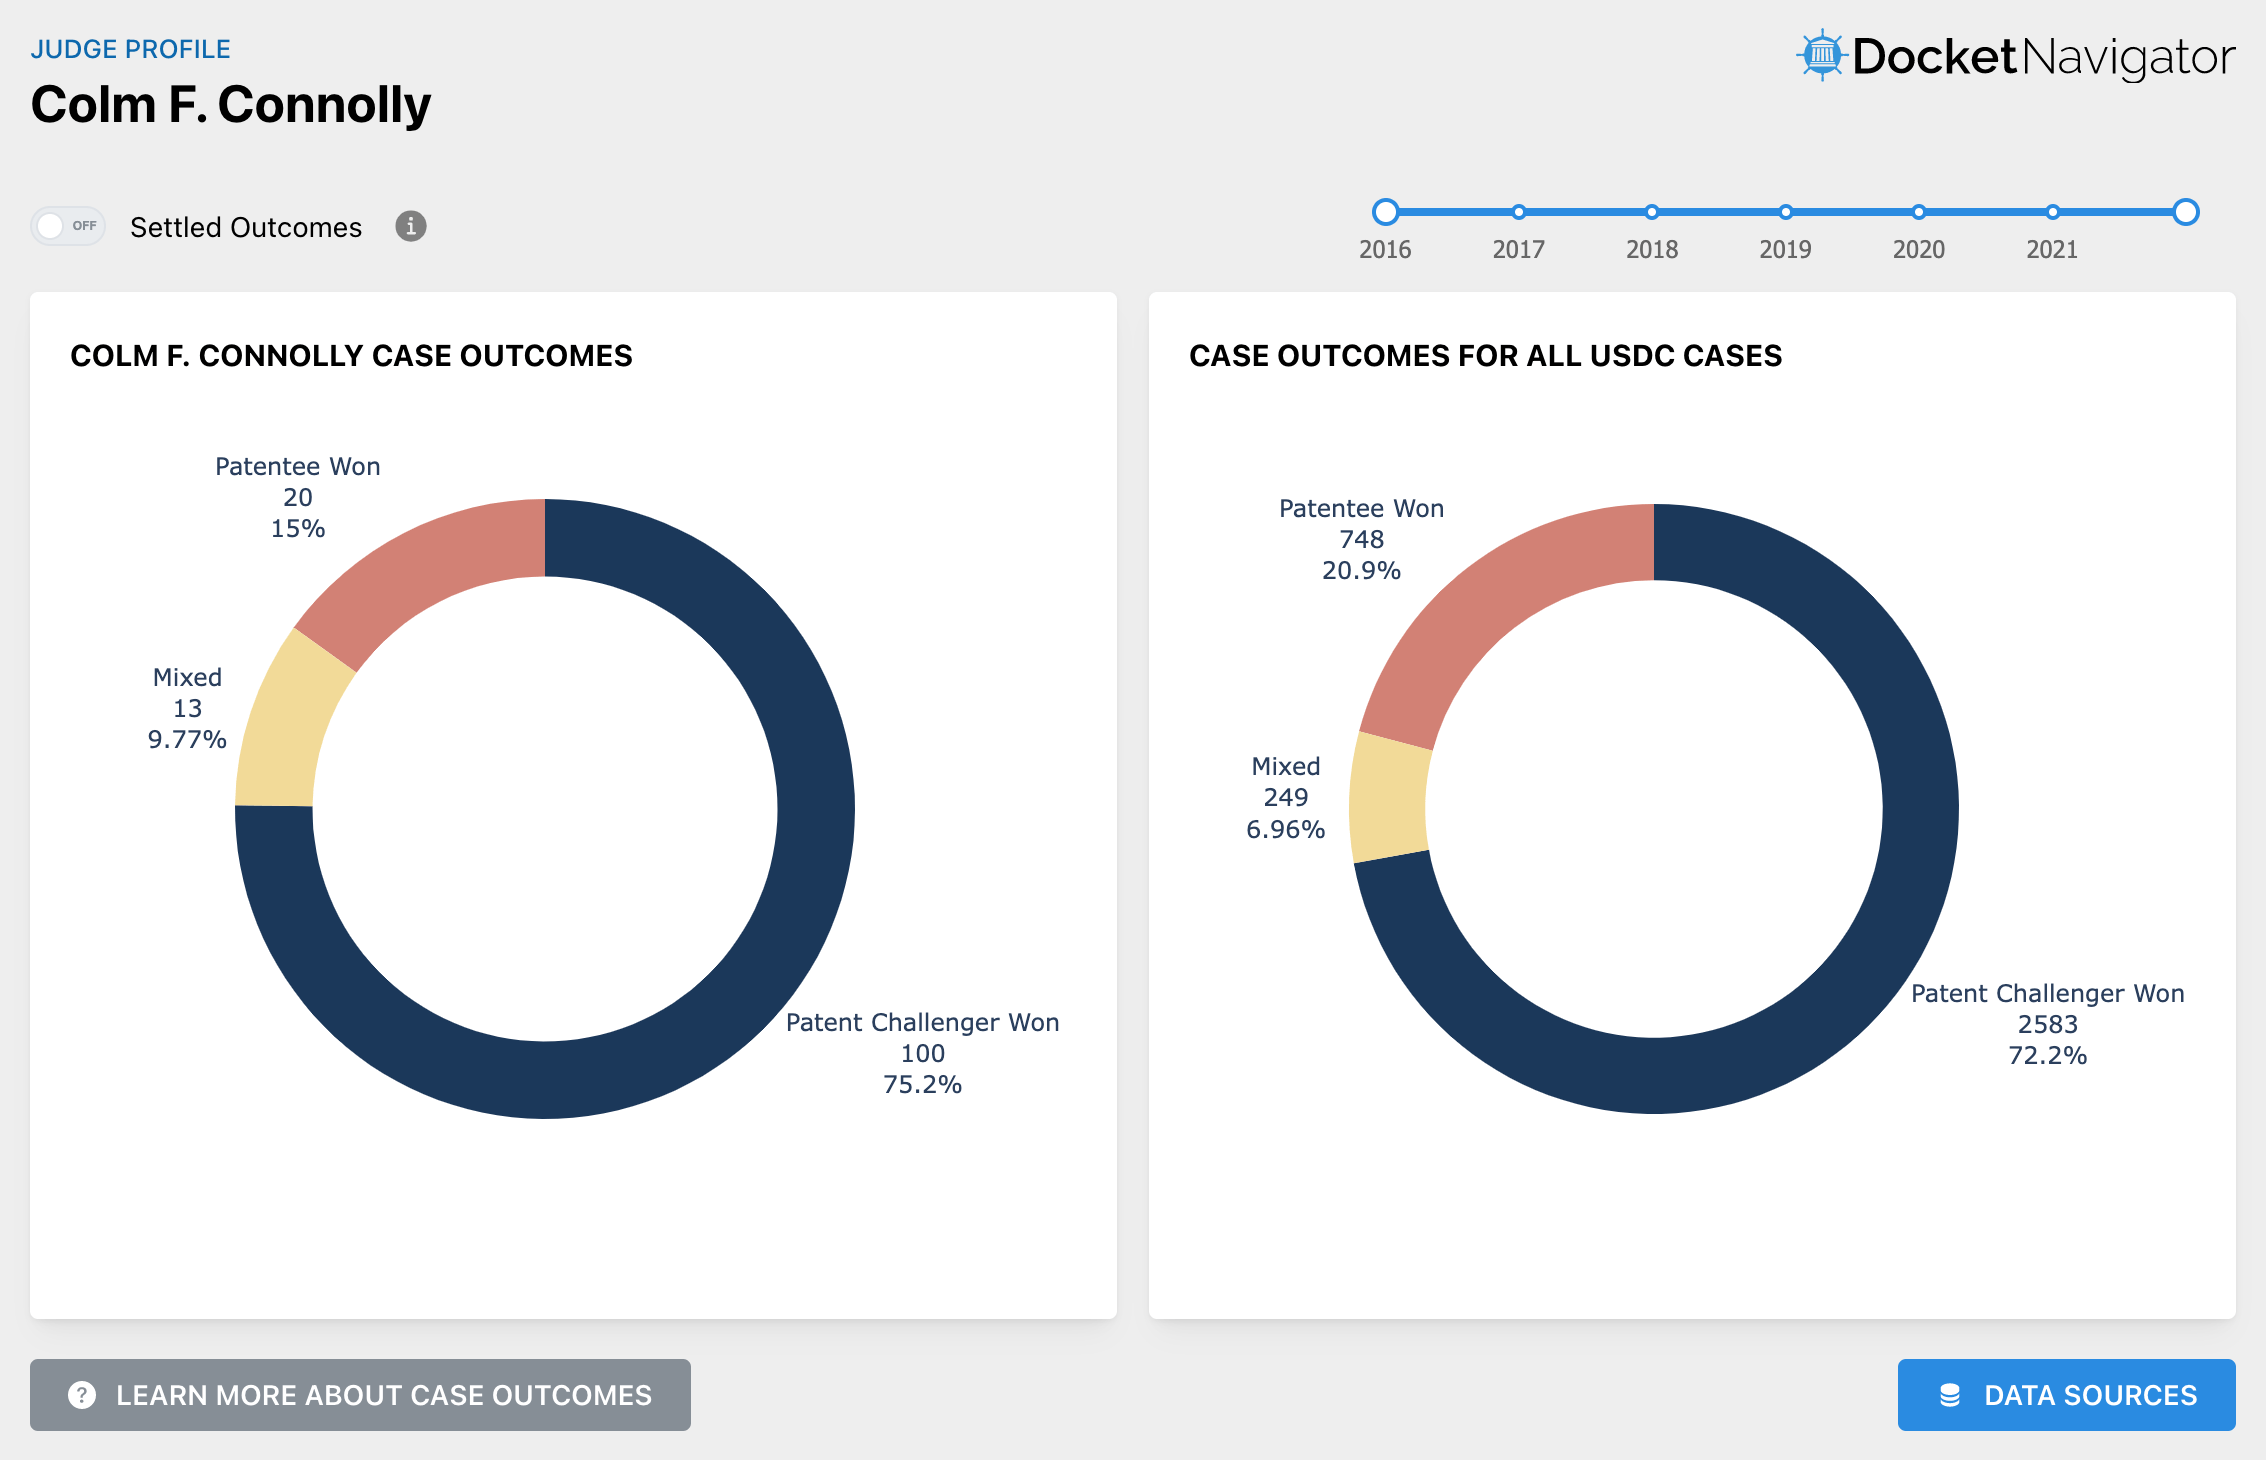
Starting today, for each judge in our system, you’ll see several new tabs on the left side of the page with new tools for understanding a judge’s patent litigation experience. Please read below for more details about the latest analytics tools available in your Docket Navigator subscription, or click on one of this past year’s busiest judges to check it out for yourself.
Overview
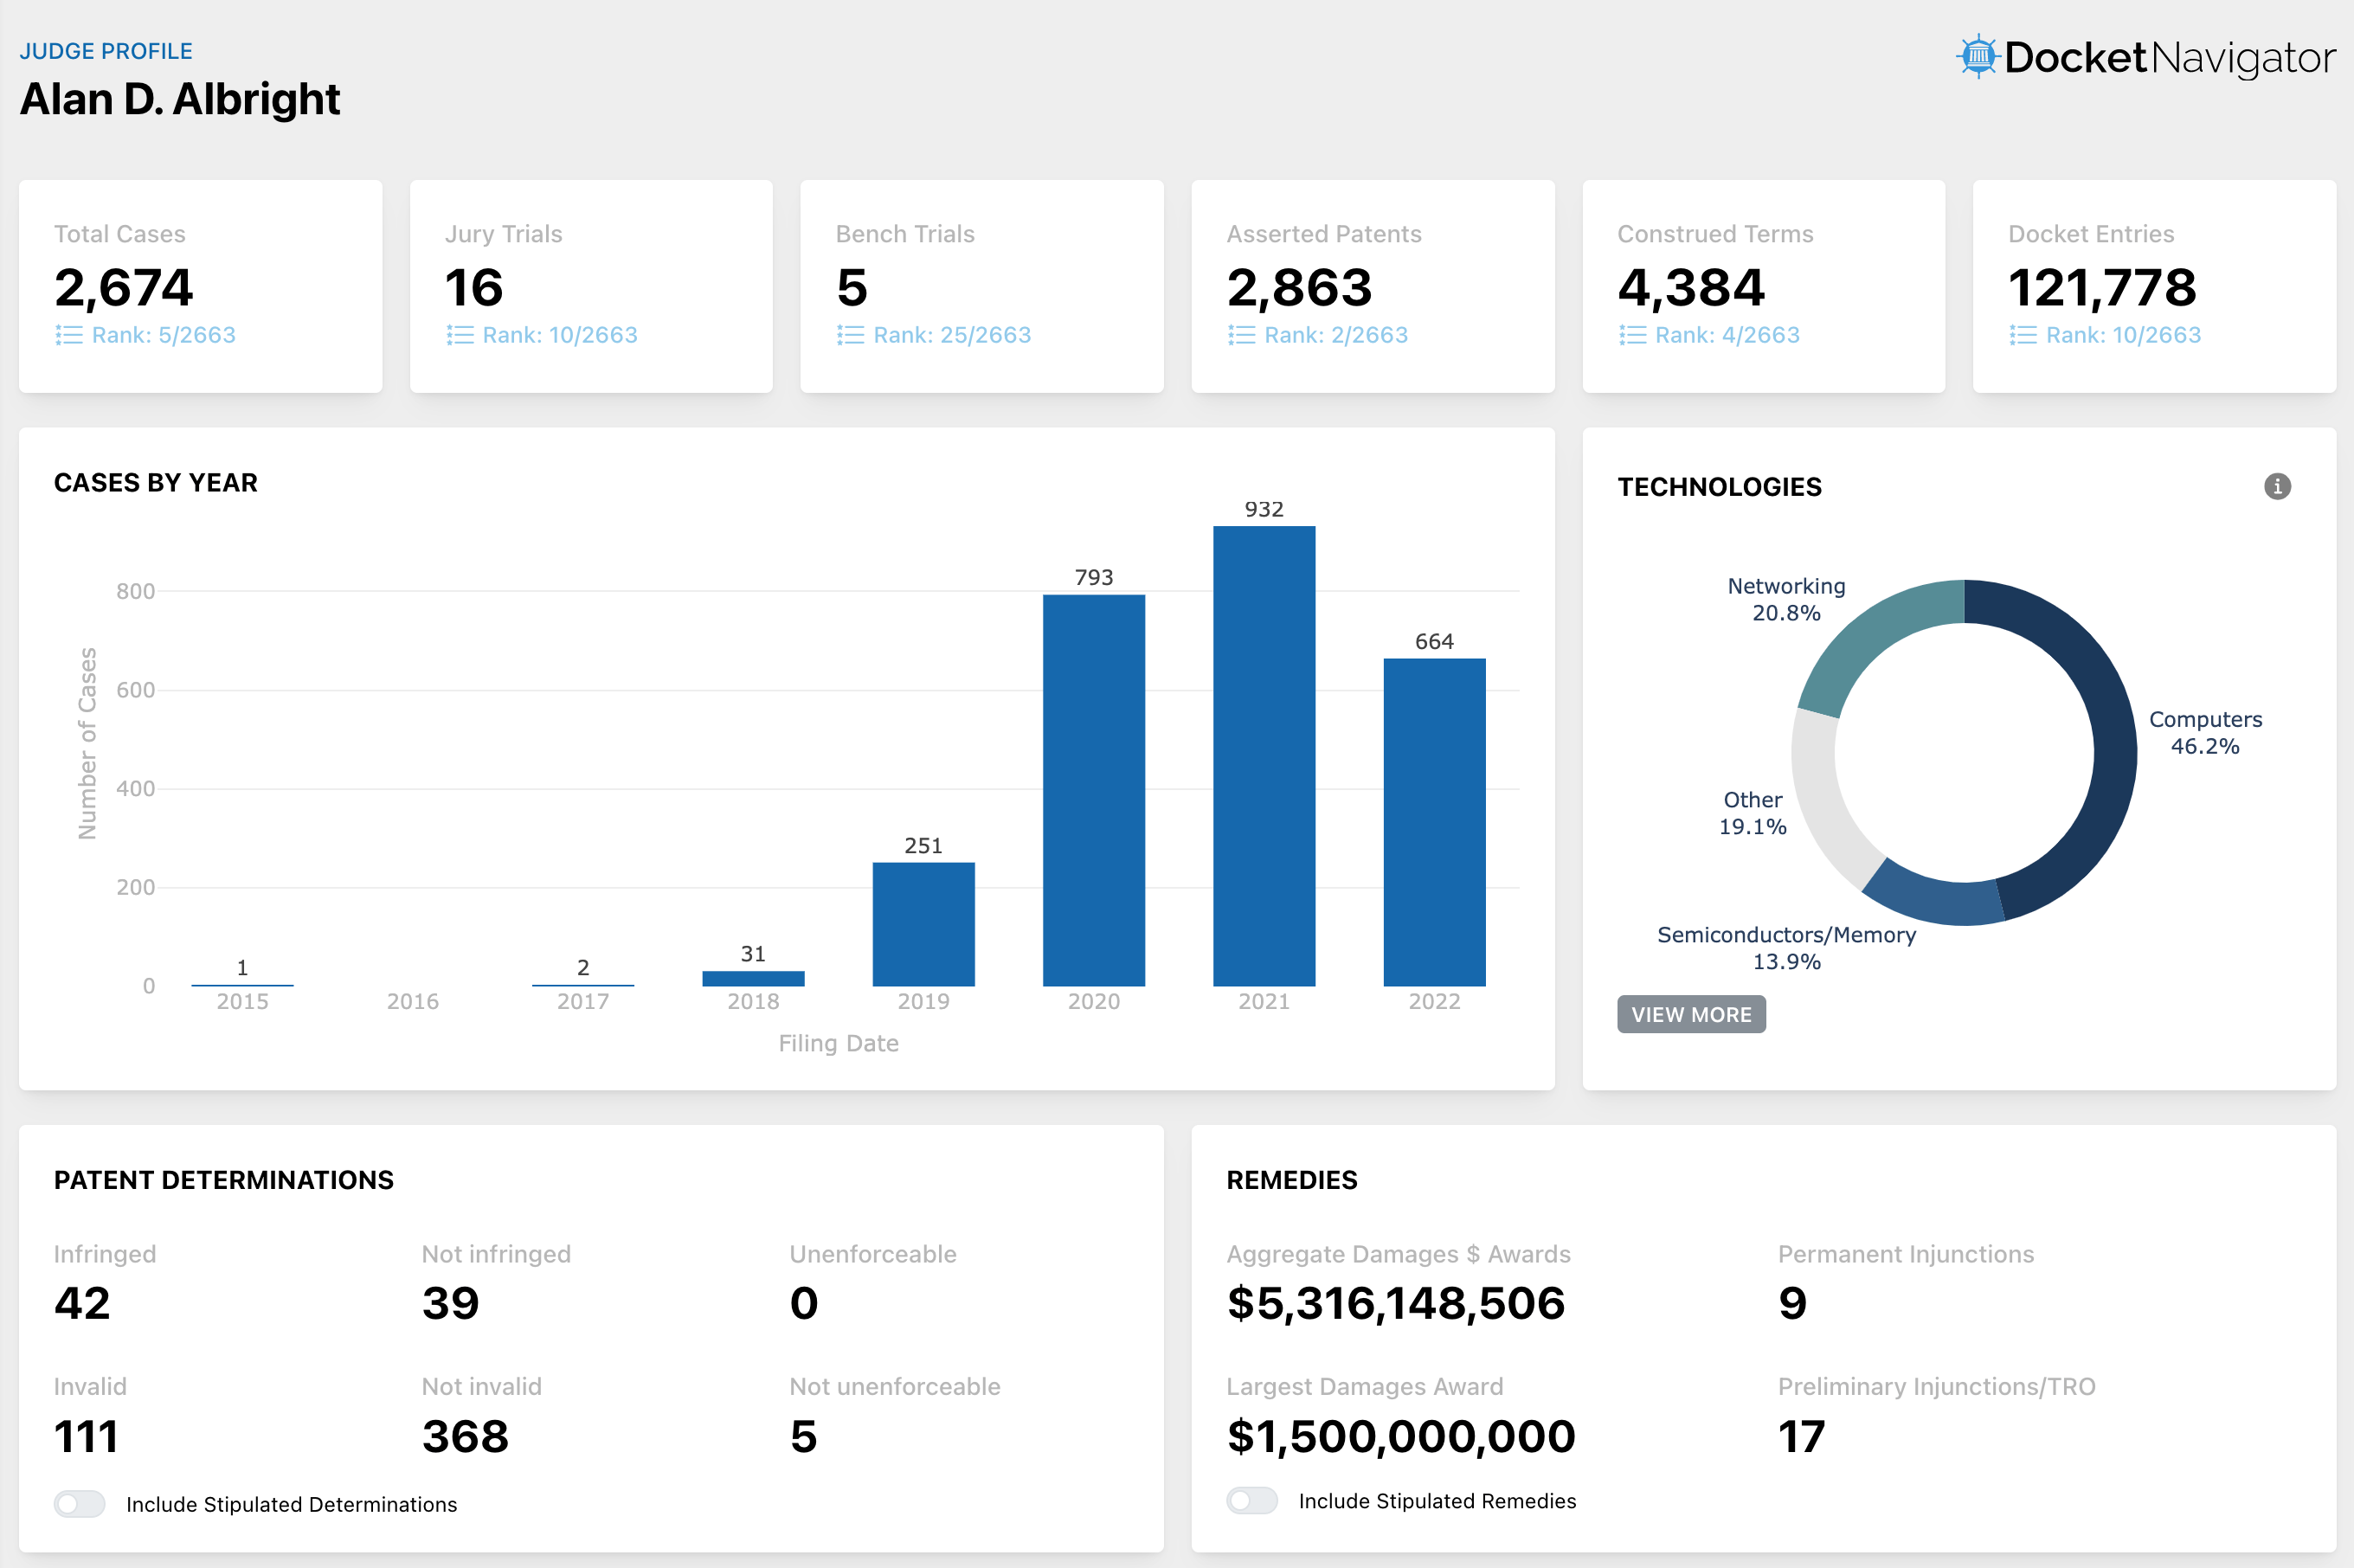
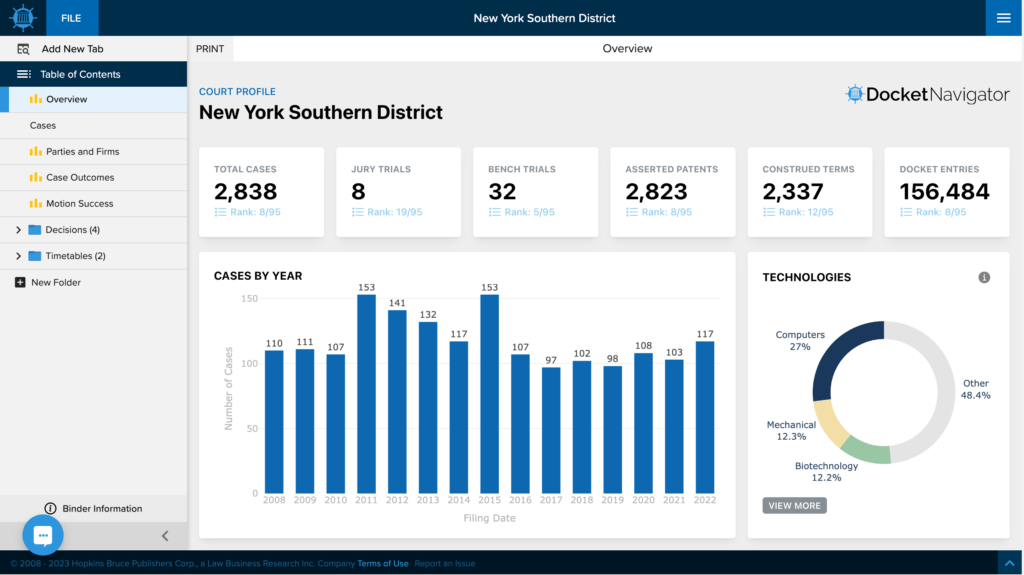
The Overview tab gives you a birds-eye view of the judge’s track record in patent litigation. View quick case stats and see where the judge ranks amongst colleagues in the same forum. Find out what patent technology centers the judge has the most experience in and evaluate summary statistics on determinations and remedies.
Appeal Outcomes
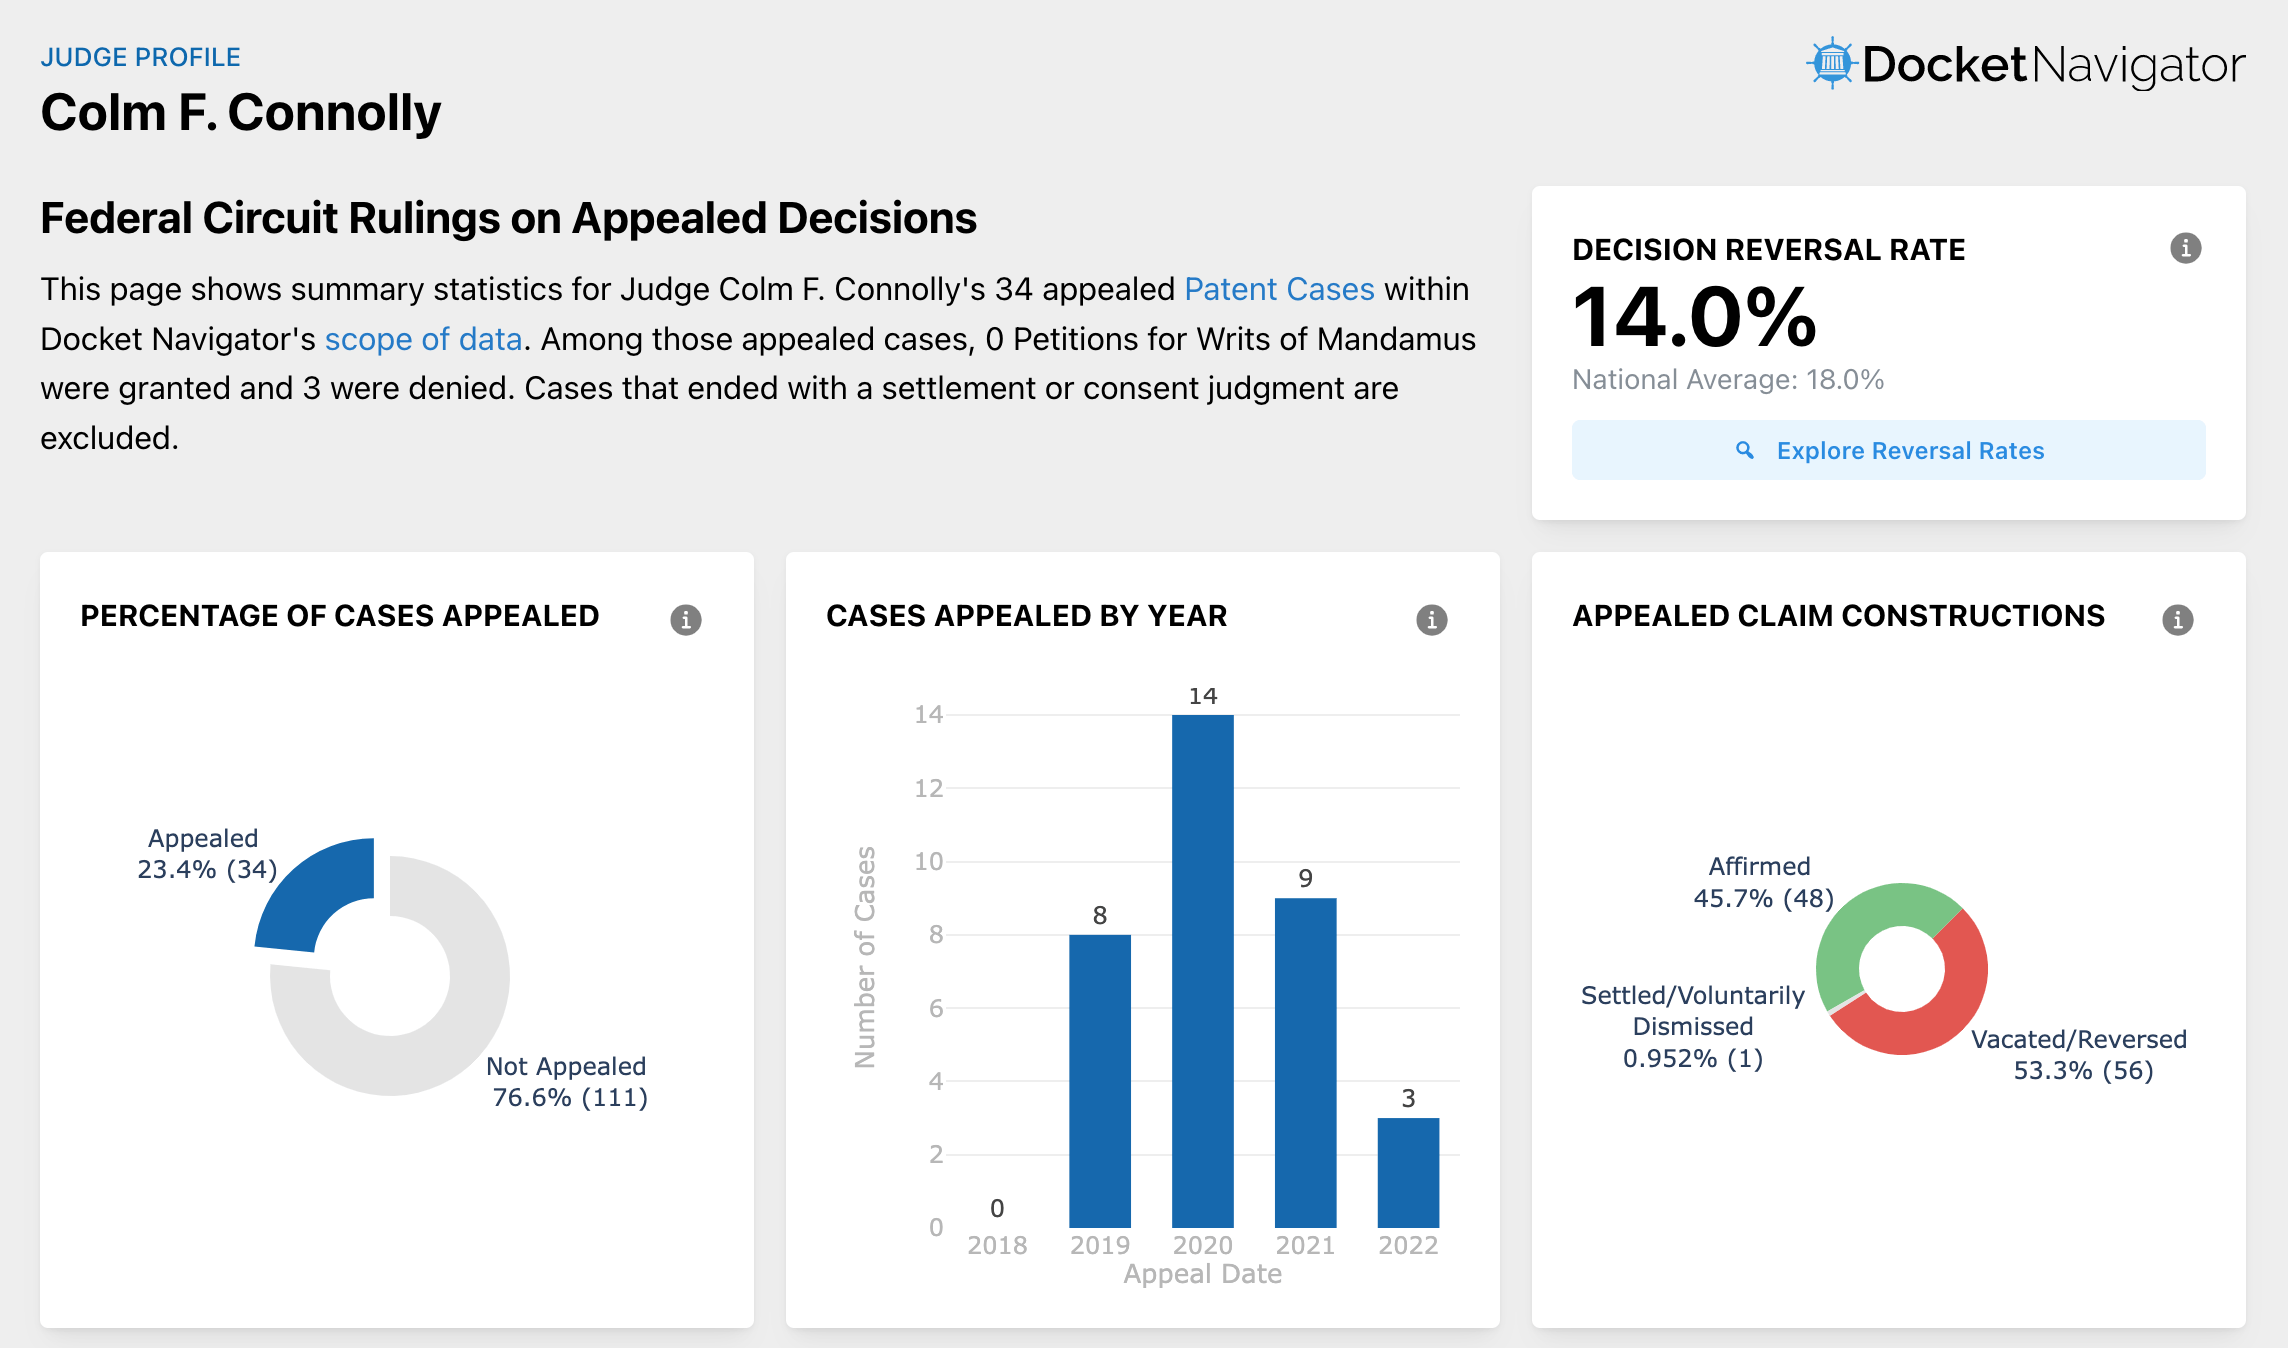
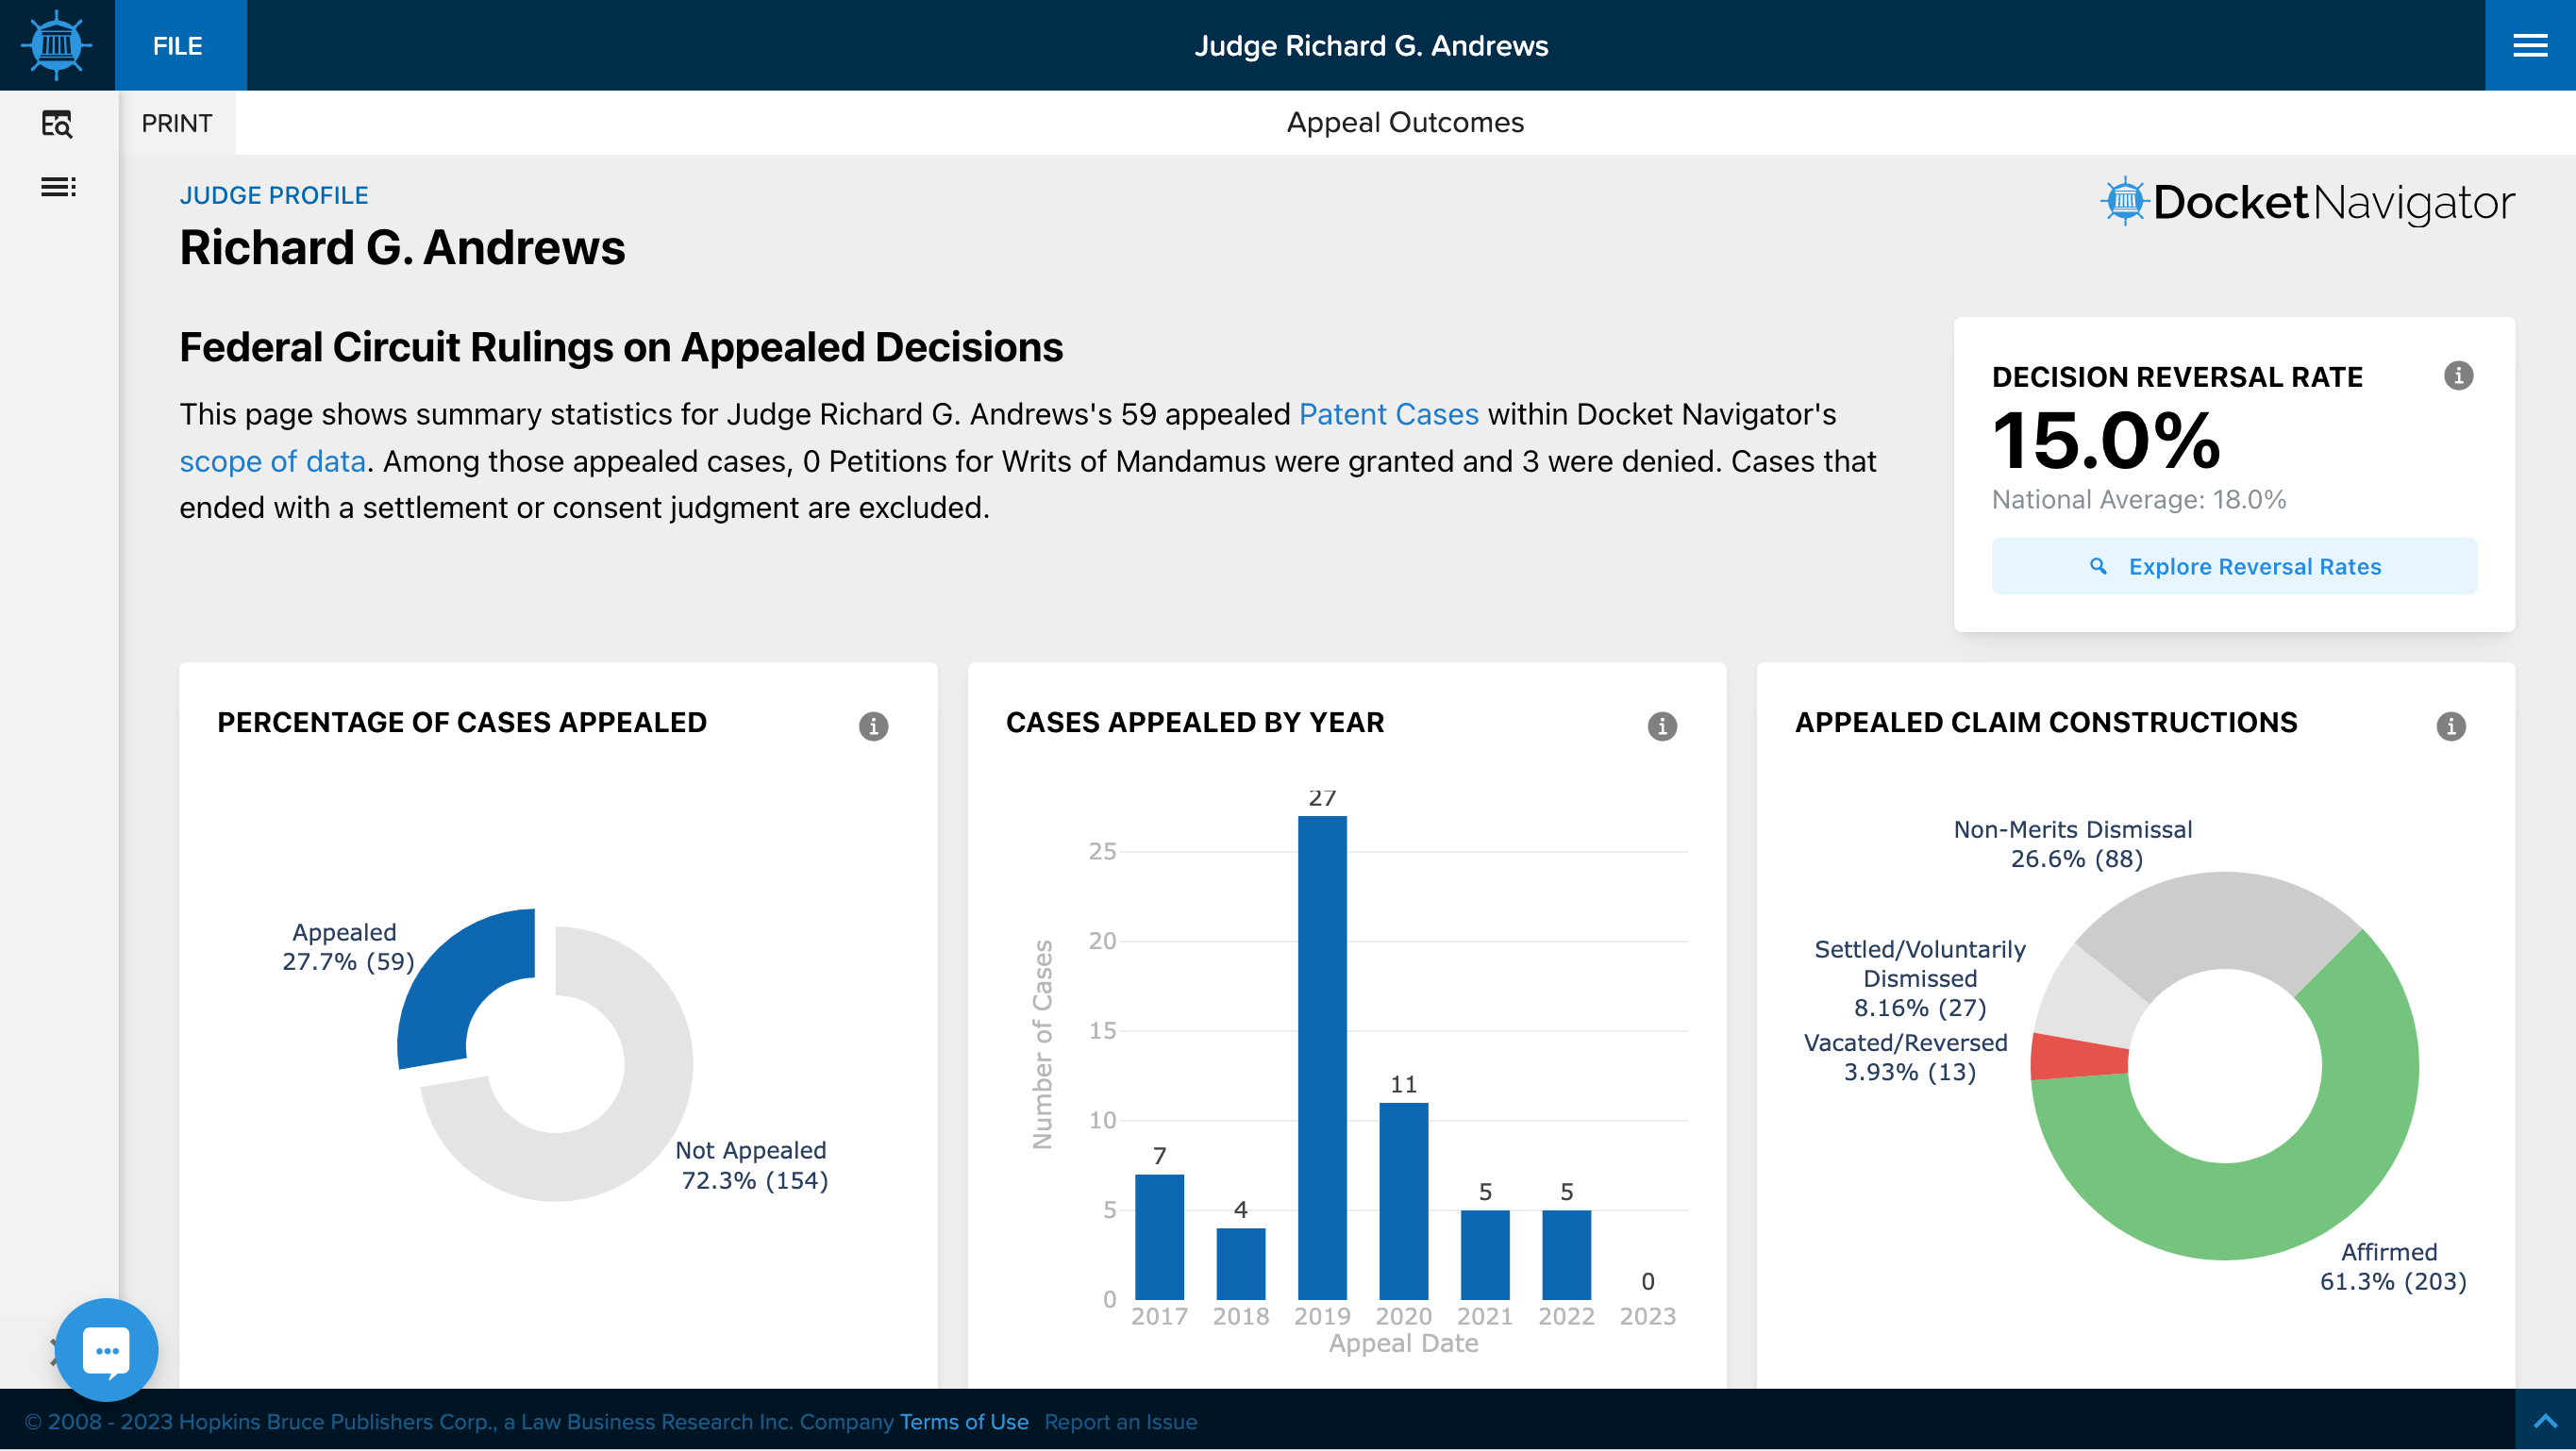
We’re also unveiling our long-awaited Appellate Analytics. Along with general appeal statistics, the Appeal Outcomes dashboard answers questions such as:
- How often is the judge reversed on appeal?
- How often are claim construction rulings reversed?
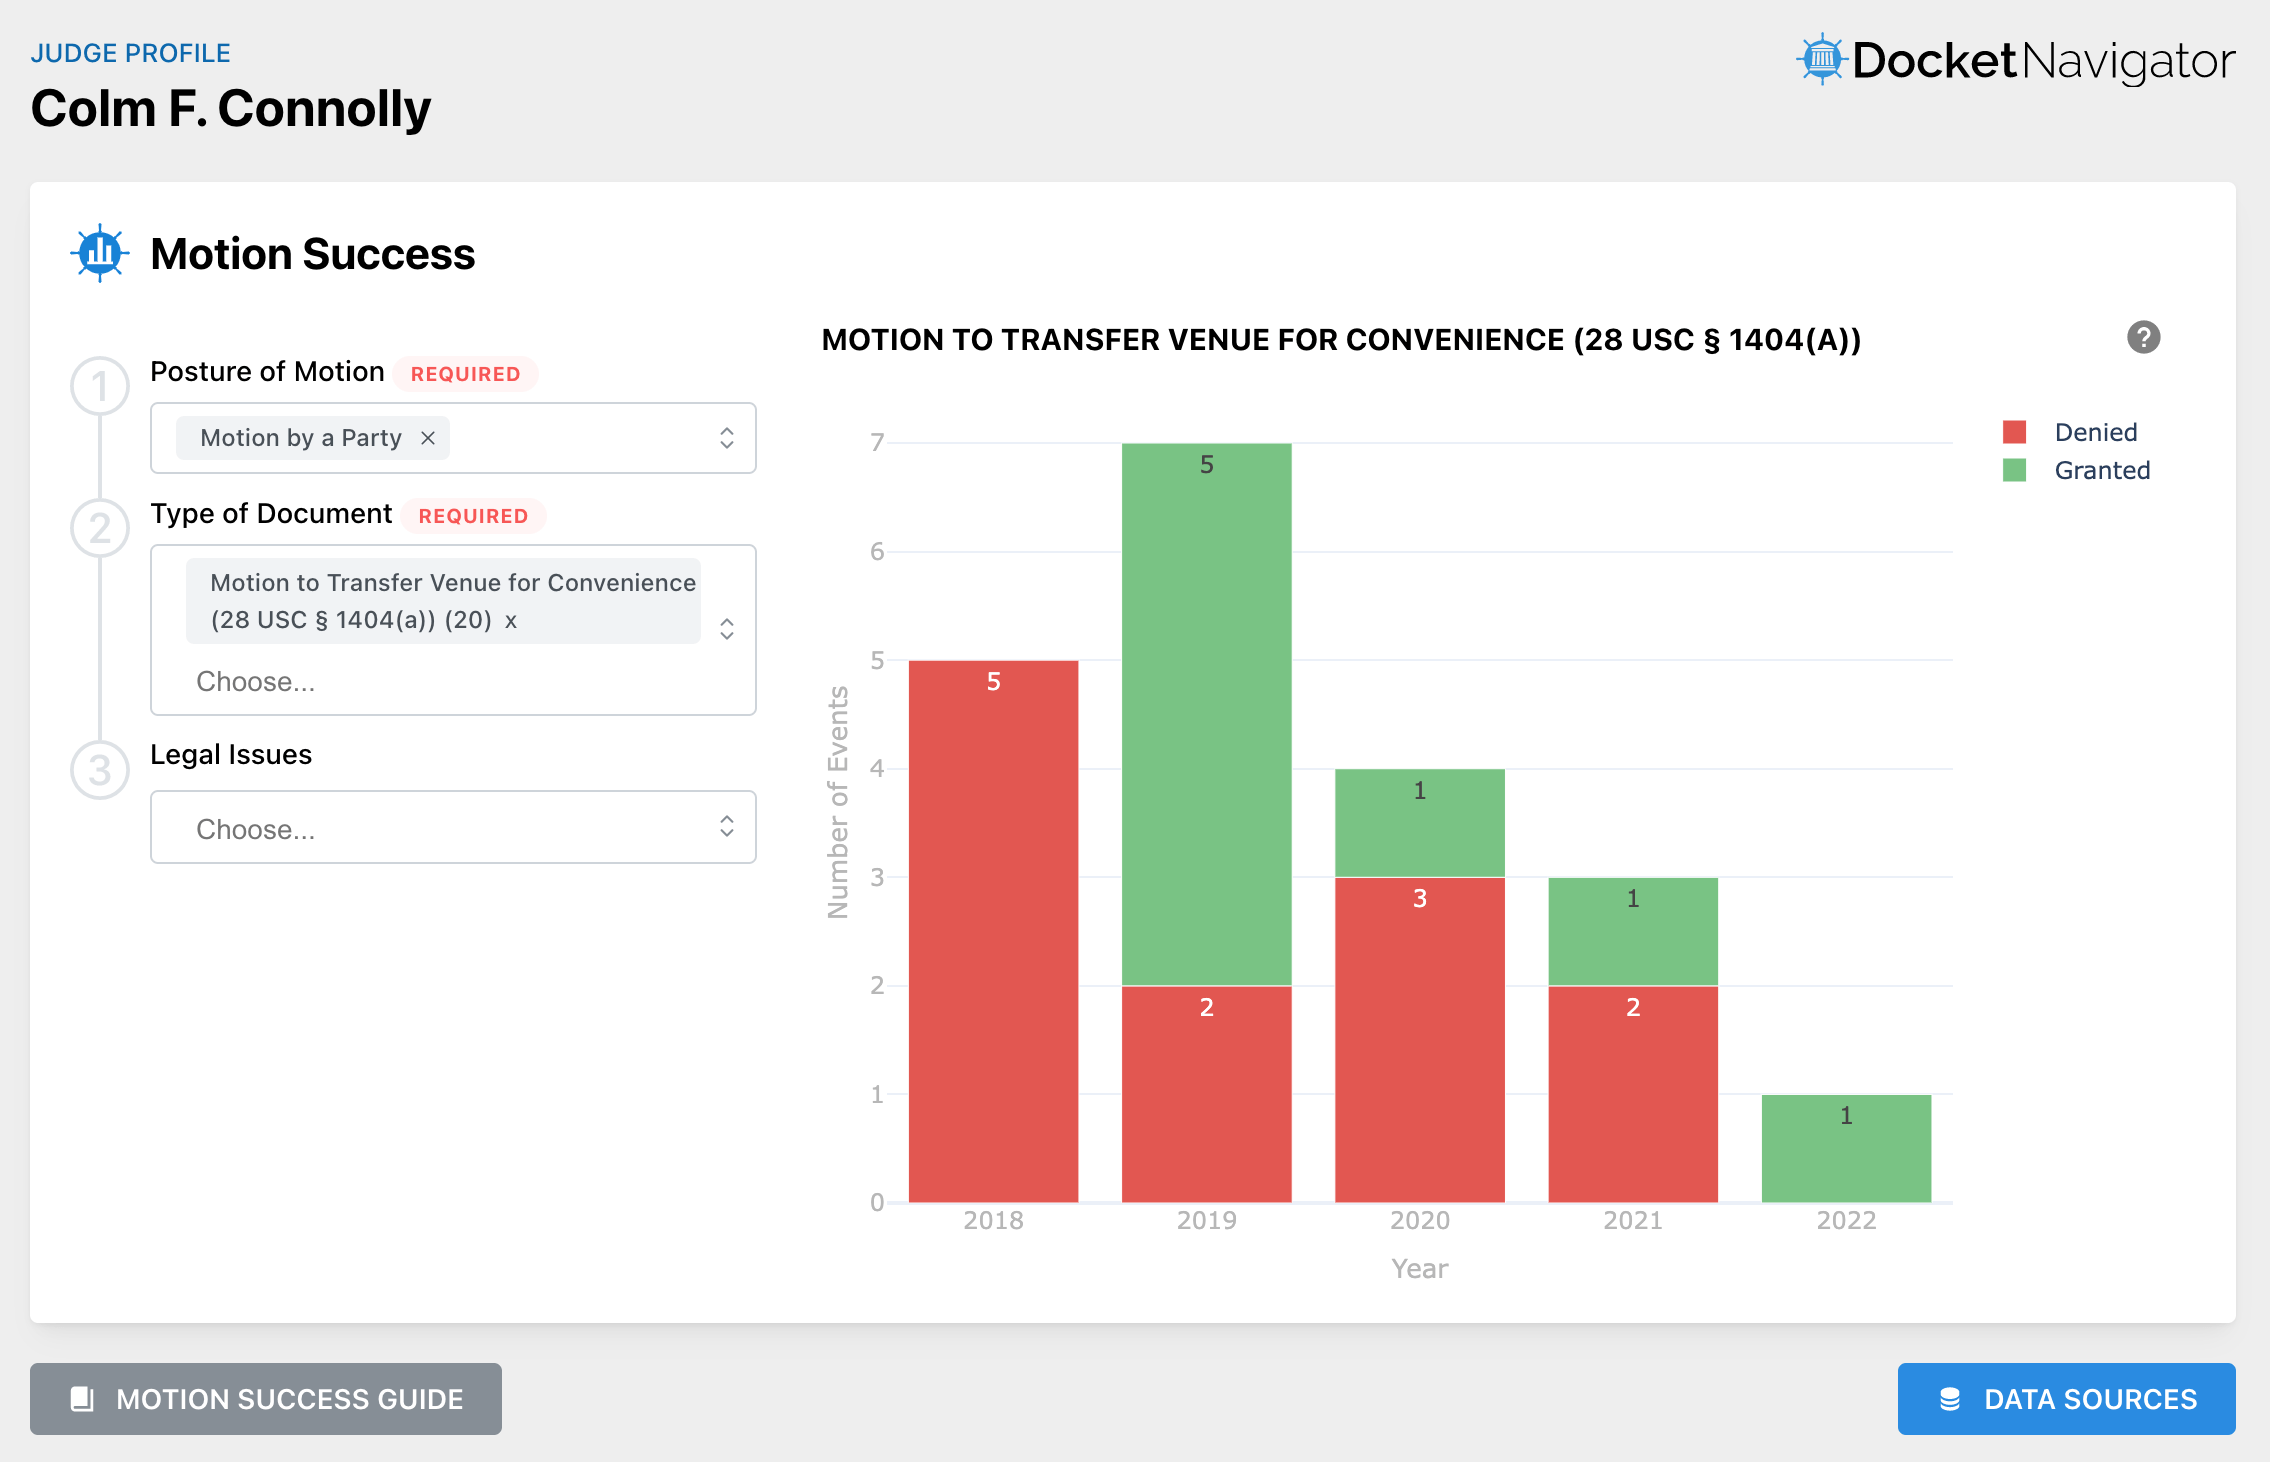
- What was the affirmance rate on transfer motions under 1404?
Use the Reversal Rates tool to choose a specific lower court type of document to see how those decisions stood on appeal.
Finding & Using Judge Profile Analytics
Analytics tools for a specific judge can be found exclusively in the Judge Profile. The Judge Profile can be accessed by clicking on a judge’s name in Docket Navigator email publications or throughout the search interface. To find a Judge Profile from the main search page, begin typing and select the judge name in the box labeled Judge in the Profiles section.
Inside the Docket Navigator Analytics Toolkit
We’ve been hard at work on a full spectrum rebuild of our analytics toolkit to give our users faster, more focused data visualizations and easy access to the data behind the charts. Here are a few of the features that come with the upgraded analytics toolkit.
